Comparing data (area 3 & 4)
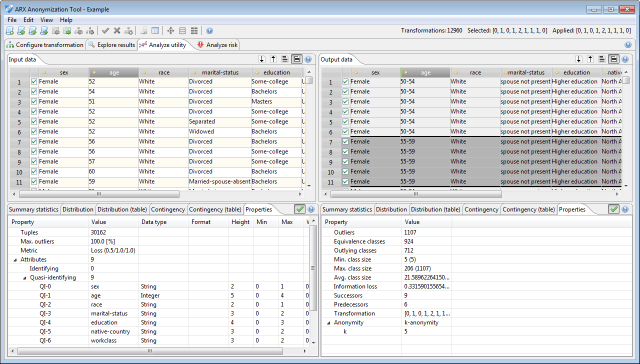
Properties of the input dataset and the anonymized dataset
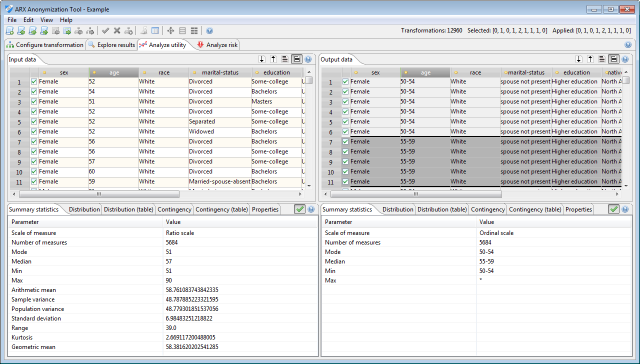
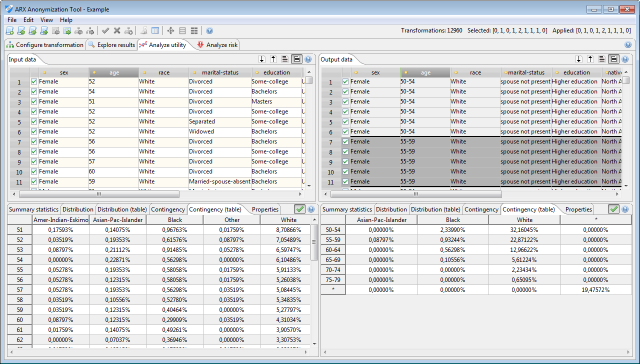
ARX tries to present comparable data visualizations for original and transformed datasets. To this end, it uses information from the attributes' data types and relationships between values extracted from the generalization hierarchies. As a result, specifying reasonable data types and hierarchies will increase the quality and comparability of data visualizations.
The first tab in this view shows summary statistics about the values of the currently selected attribute.
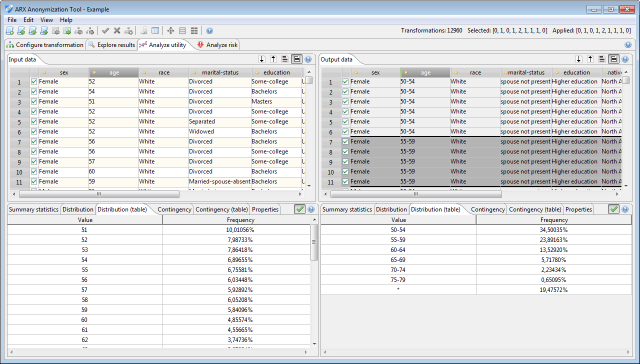
The second and the third tab shows the frequency distribution of values of the currently selected attribute.
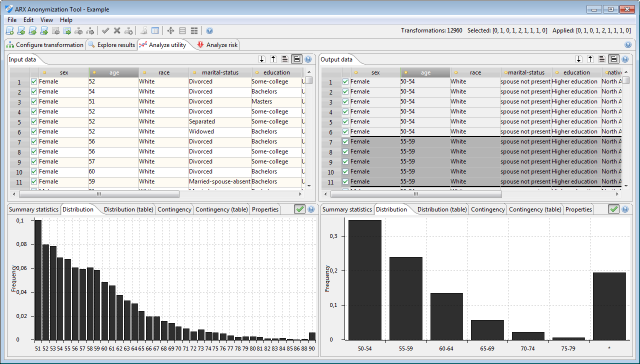
The second tab displays a histogram, the third tab displays a table.
The fourth and fifth tabs show the contingency of the two currently selected attributes.
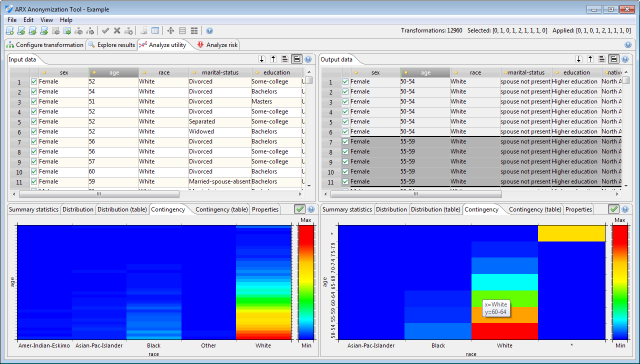
The fourth tab visualizes contingency with a heatmap, whereas the fifth presents the data as a table.
Properties of the selected transformation
The last tab displays basic properties about the currently applied transformation and about the input configuration. For the input dataset these properties include, the number of data entries and the suppression limit as well as a shallow specification of all attributes in the dataset. Further properties are displayed for the transformed dataset. These include the actual number of outliers, the number of equivalence classes and the number of outlying classes, data utility and privacy guarantees. Note that this information represents the specification that has been defined in the configuration perspective prior to performing the anonymization process. The state of the workbench will remain unchanged, even if these definitions are changed. To incorporate changes (e.g., adjusted generalization hierarchies) into the exploration and utility analysis perspectives, the data needs to be anonymized again.
Recent Comments