Exploration
Overview
Visualization of the solution space
Filtering the solution space
Using the clipboard
Properties of transformations
Exploring the solution space
In this perspective, the solution space can be browsed and transformations can be applied to the input dataset.
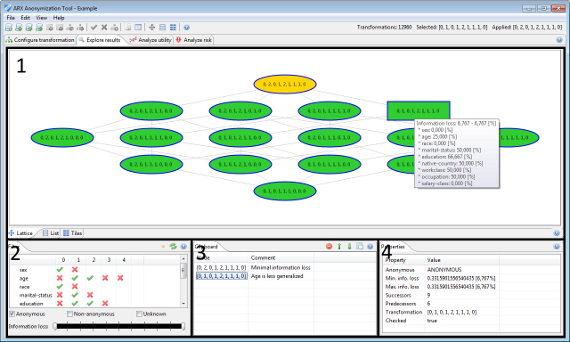
In area 1 a subset of the current solution space is displayed. The transformations which are shown here can be selected by using filters that are provided in area 2. Area 3 implements a clip board in which transformations can be stored and annotated, while area 4 displays properties of the currently selected transformation.
Apart from some shortcuts to menu entries, ARX's application toolbar also displays some information from this perspective: (1) the currently selected transformation, (2) the currently applied transformation as well as some statistics collected during the anonymization process. These statistics include the number of privacy-preserving transformations and the total number of transformations in the solution space as well as some statistics about the search process.
Each transformation is identified by the generalization levels which it specifies for the quasi-identifiers in the input dataset.
Please note that since version 3.7.0 ARX supports a local transformation method which applies different transformation schemes to different parts of the input dataset. In this case, the exploration perspective displays the individual transformations applied to the dataset.
Visualization of the solution space
In the center of the screen, the view displays a subset of the current solution space. The solution space is visualized in different ways. First, it can be displayed as a Hasse diagram of the underlying generalization lattice.
Here, each node represents a single transformation, which is identified by the generalization levels that it specifies for the quasi-identifiers in the input dataset. Transformations are characterized by three different background colors:
- Green denotes a transformation that results in a privacy-preserving dataset.
- Red denotes a transformation that does not result in an privacy-preserving dataset.
- Orange denotes the transformation that is optimal regarding to the specified utility measure.
Transformations which have not been pruned during the anonymization process are marked with a thick blue border. Dragging the mouse while holding the left button can be used to navigate the visualization. Dragging the mouse while holding the right button can be used to zoom in and out of the current view. Hovering the mouse over a transformation will display a tool tip with basic information about the transformation. Clicking a transformation with the left button will select it, while clicking a transformation with the right button will prompt a context menu. Here, transformations can either be applied to the current input dataset or added to the clipboard.
The solution space may also be visualized as a list:
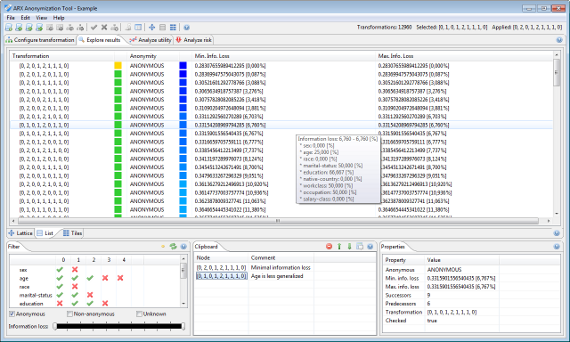
Here, each transformation is represented by one row. Transformations are sorted by score. Utility estimates and the anonymity property are highlighted visually.
Finally, the solution space can also be visualized as a set of tiles:
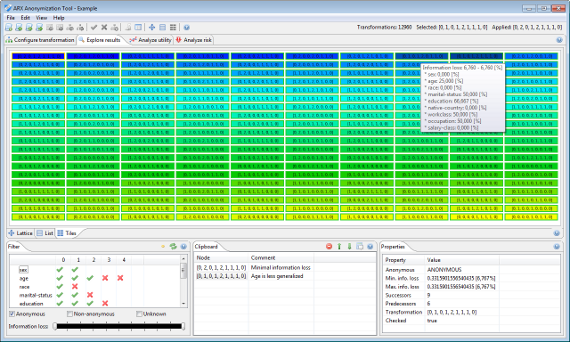
This view is very similar to the list described in the previous paragraph. The color and border of an element encode information about the anonymity property, while the background color represents data utility. Transformations are also ordered by their score.
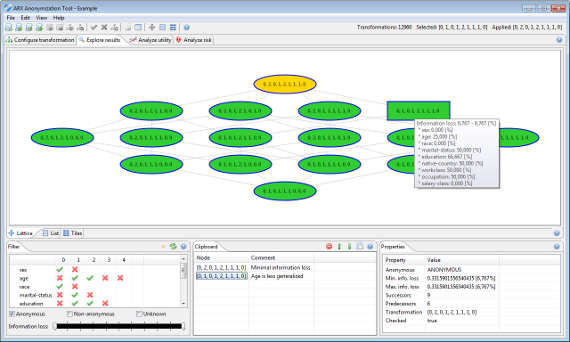
Filtering the solution space
This view supports selecting a set of transformations from the solution space that will be displayed in the exploration perspective. Transformations may be restricted to those with specific generalization levels for specific attributes or to those that do or do not fulfill the anonymity requirements.
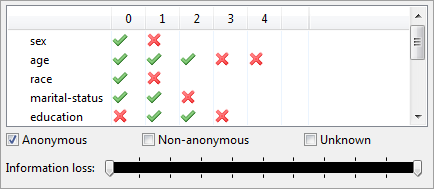
The sliders at the bottom can be used to select transformations with a score that is in between the configured bounds. Note that the scores of transformations which have not been checked explicitly are not known and that they are therefore estimated with bounding intervals that are computed from other transformations in the solution space. These estimates might be wrong when a heuristic anonymization process with a time limit has been performed.
Please note that since version 3.7.0 ARX supports a local transformation method which applies different transformation schemes to different parts of the input dataset. If this option is used, this view will be disabled.
Organizing transformations
This view contains a clipboard, which can be used to organize and annotate transformations. Right-clicking an entry opens up a context menu, which allows to remove the transformation, apply it to the current dataset and to edit its annotations.
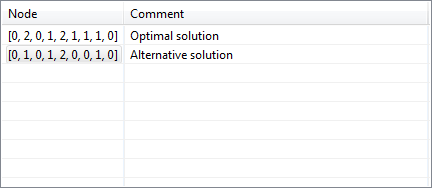
The buttons in the upper right corner support removing all entries, changing their order and sorting them according to the resulting reductions in data utility.
Please note that since version 3.7.0 ARX supports a local transformation method which applies different transformation schemes to different parts of the input dataset. If this option is used, this view will be disabled.
Properties of transformations
Basic information about the currently selected transformation will be displayed in this view. The highest and lowest scores are shown as absolute values and as values relative to the highest and lowest scores of all transformations in the solution space.
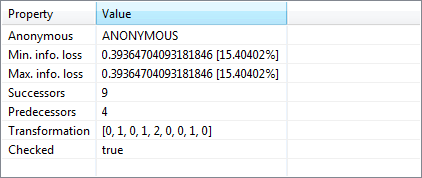
The view also displays the number of successors and predecessors of a transformation, the generalization levels which are specified for the quasi-identifiers and whether the transformation has been pruned during the anonymization process.
Please note that since version 3.7.0 ARX supports a local transformation method which applies different transformation schemes to different parts of the input dataset. If this option is used, this view will display additional properties of the individual transformations applied, such as the number of affected records.