Help: Equivalence Classes
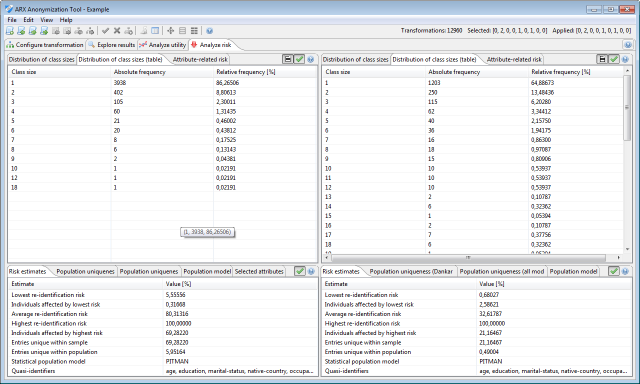
Analyzing equivalence class sizes (area 1 & area 2)
In this view, the distribution of sizes of equivalence classes (or cells) can be analyzed. The distribution is displayed for both input and output.
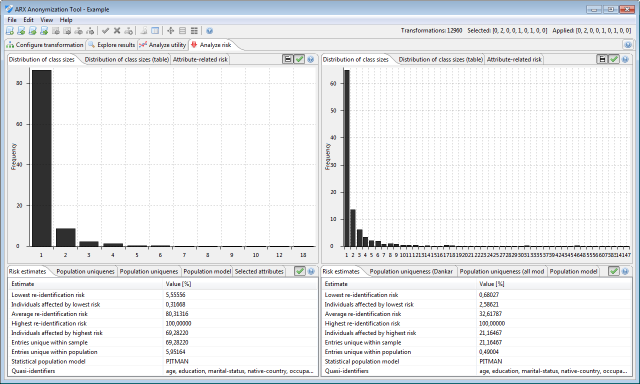
The data may be displayed as a histogram or as a table.
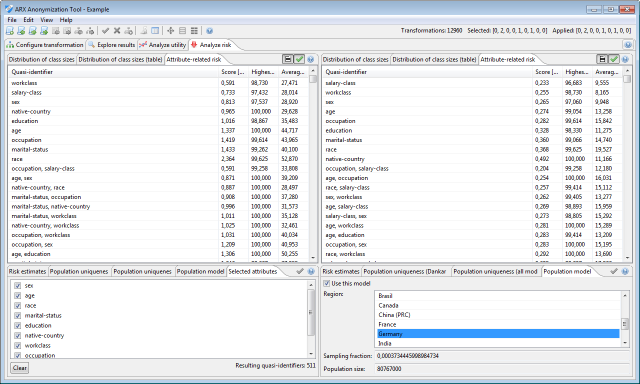
Analyzing quasi-identifiers (area 1 & area 2)
In the following view, combinations of attributes may be analyzed for associated risks of re-identification. This analysis uses estimates of uniqueness either based on the sample or on a super-population model. You may specify this in the settings dialog. First, you must select a set of attributes to analyze in the bottom left area. ARX will then determine the average risk of re-identification that is associated with the power set of the selected set of attributes. You may use this information to decide which quasi-identifiers need to be protected in your dataset.